
티스토리 뷰
python/django_ERP2
(macOS)[python] django-erp : chart - #2 chart.js ORM/javascript 데이터 연동 적용
jinozpersona 2021. 12. 18. 20:30INTRO
Python 3.10.0
Django 3.2.8
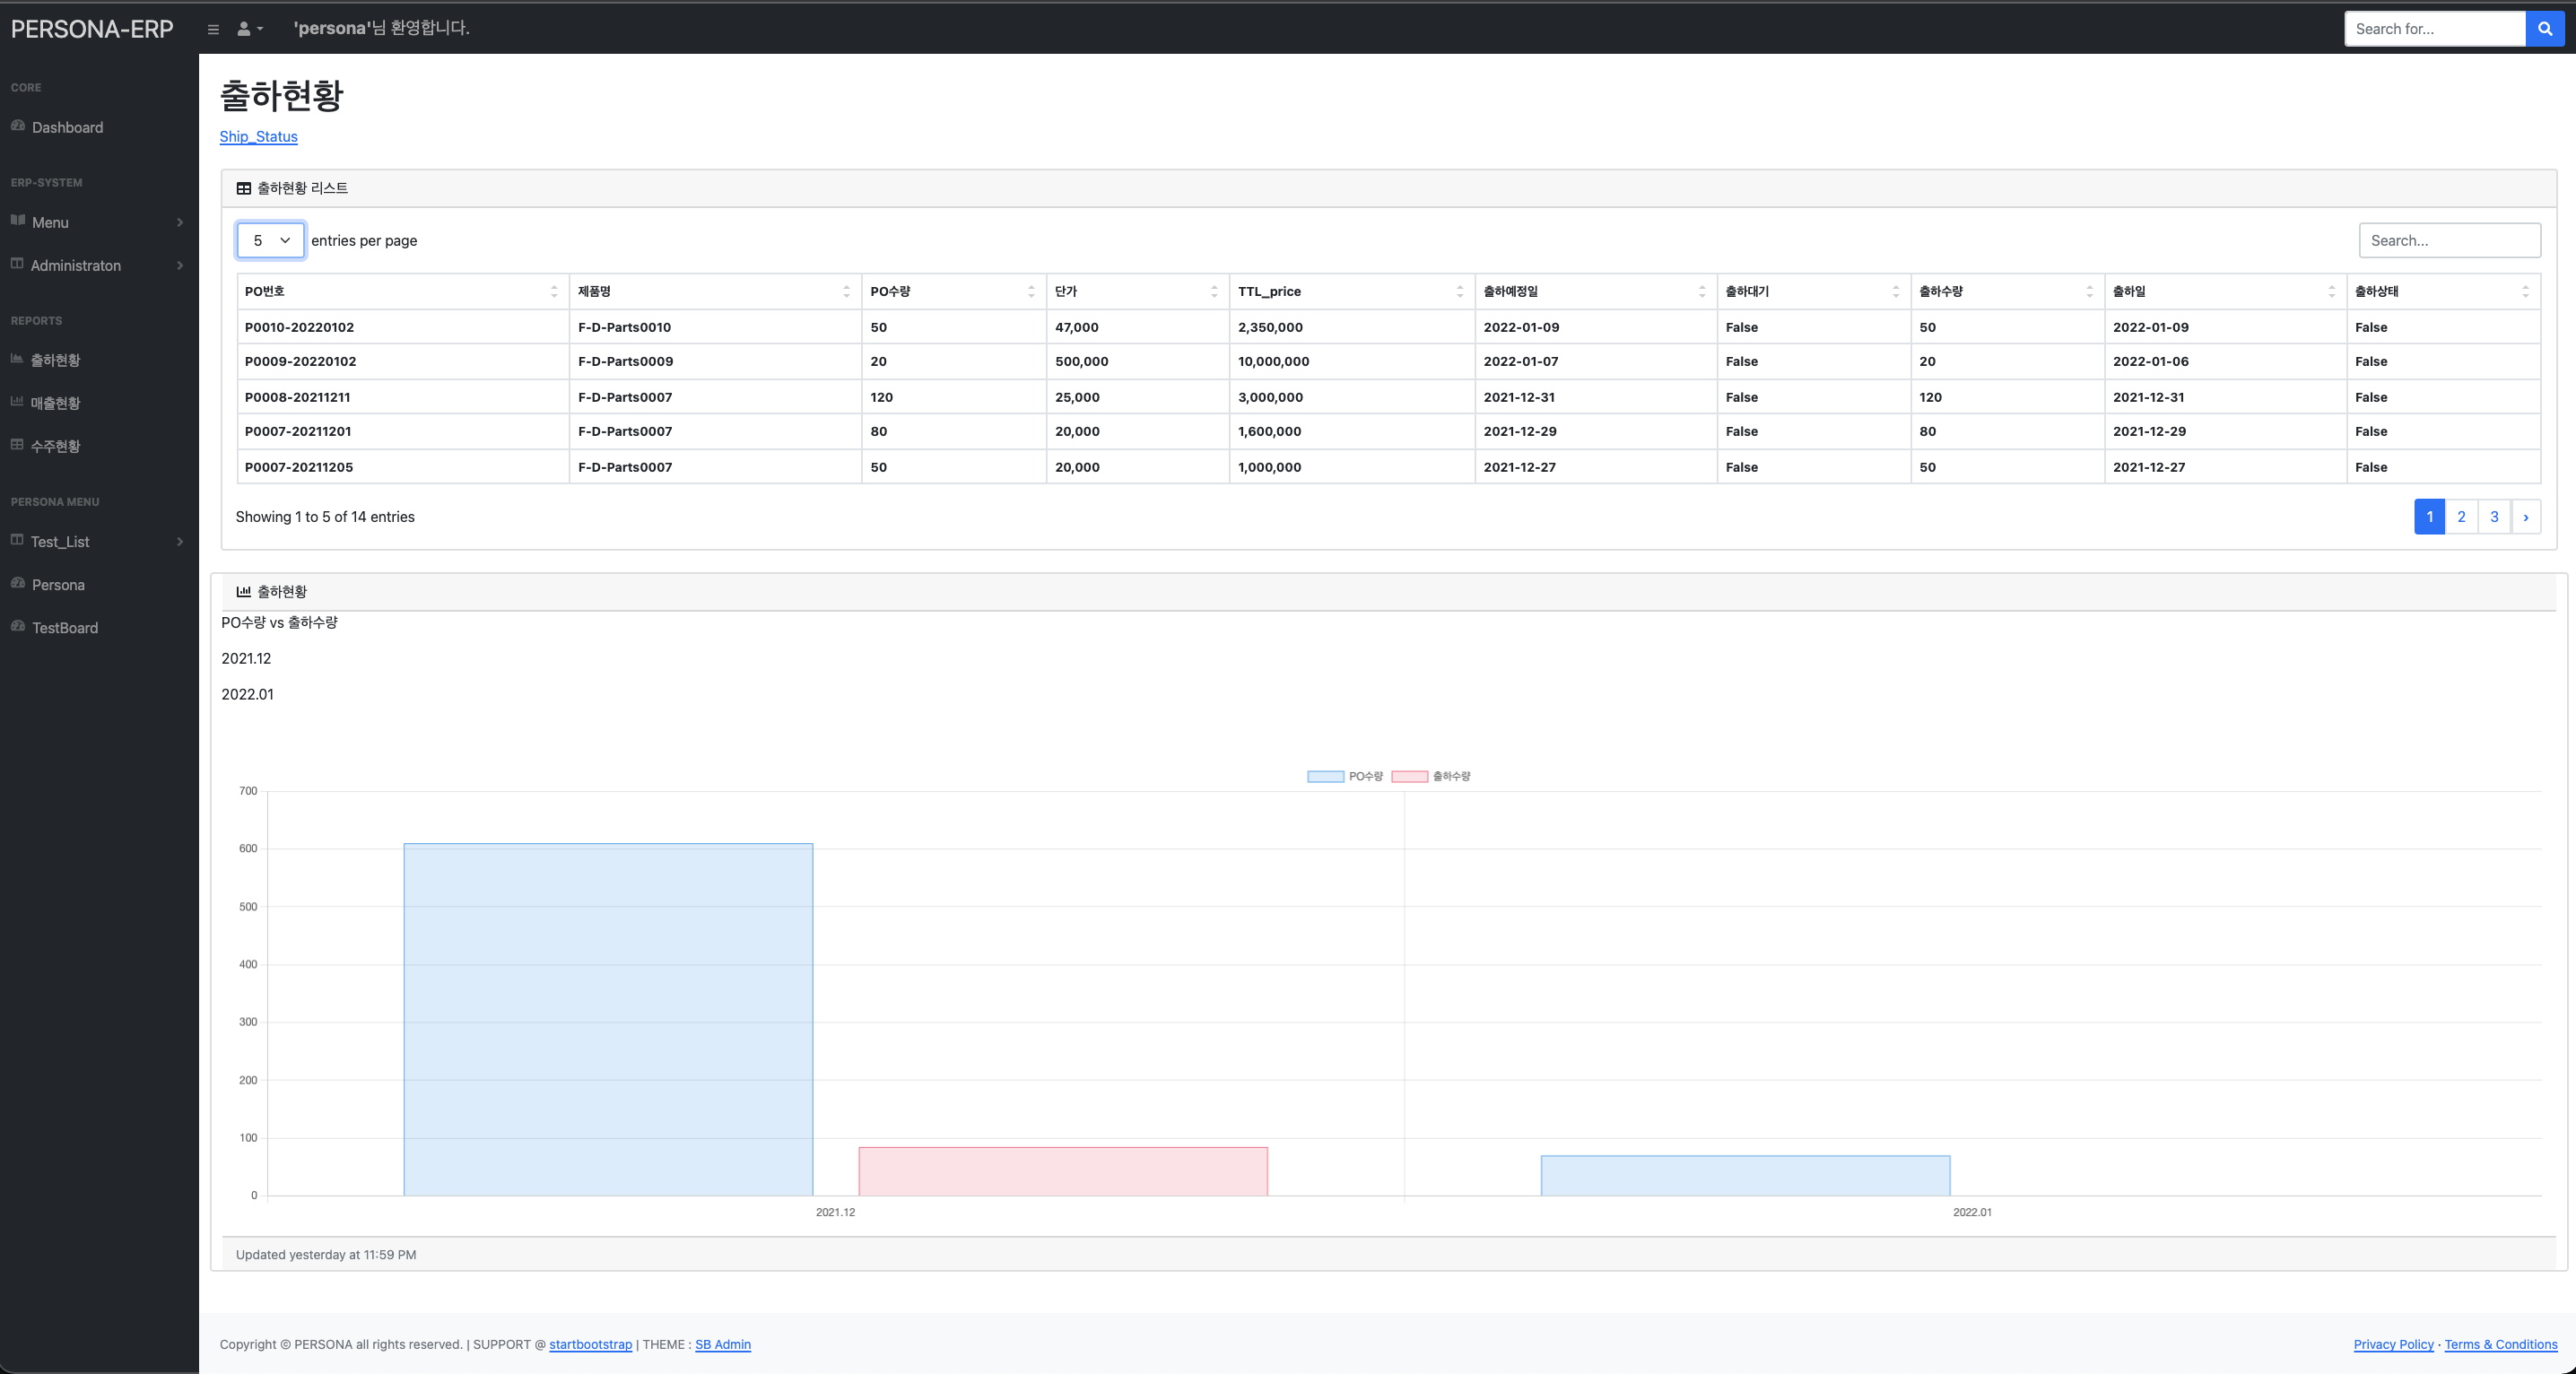
table/charts 적용 후 미리보기
- localhost:8000/home/ship_status/ : sidebar 출하현황 클릭 이동
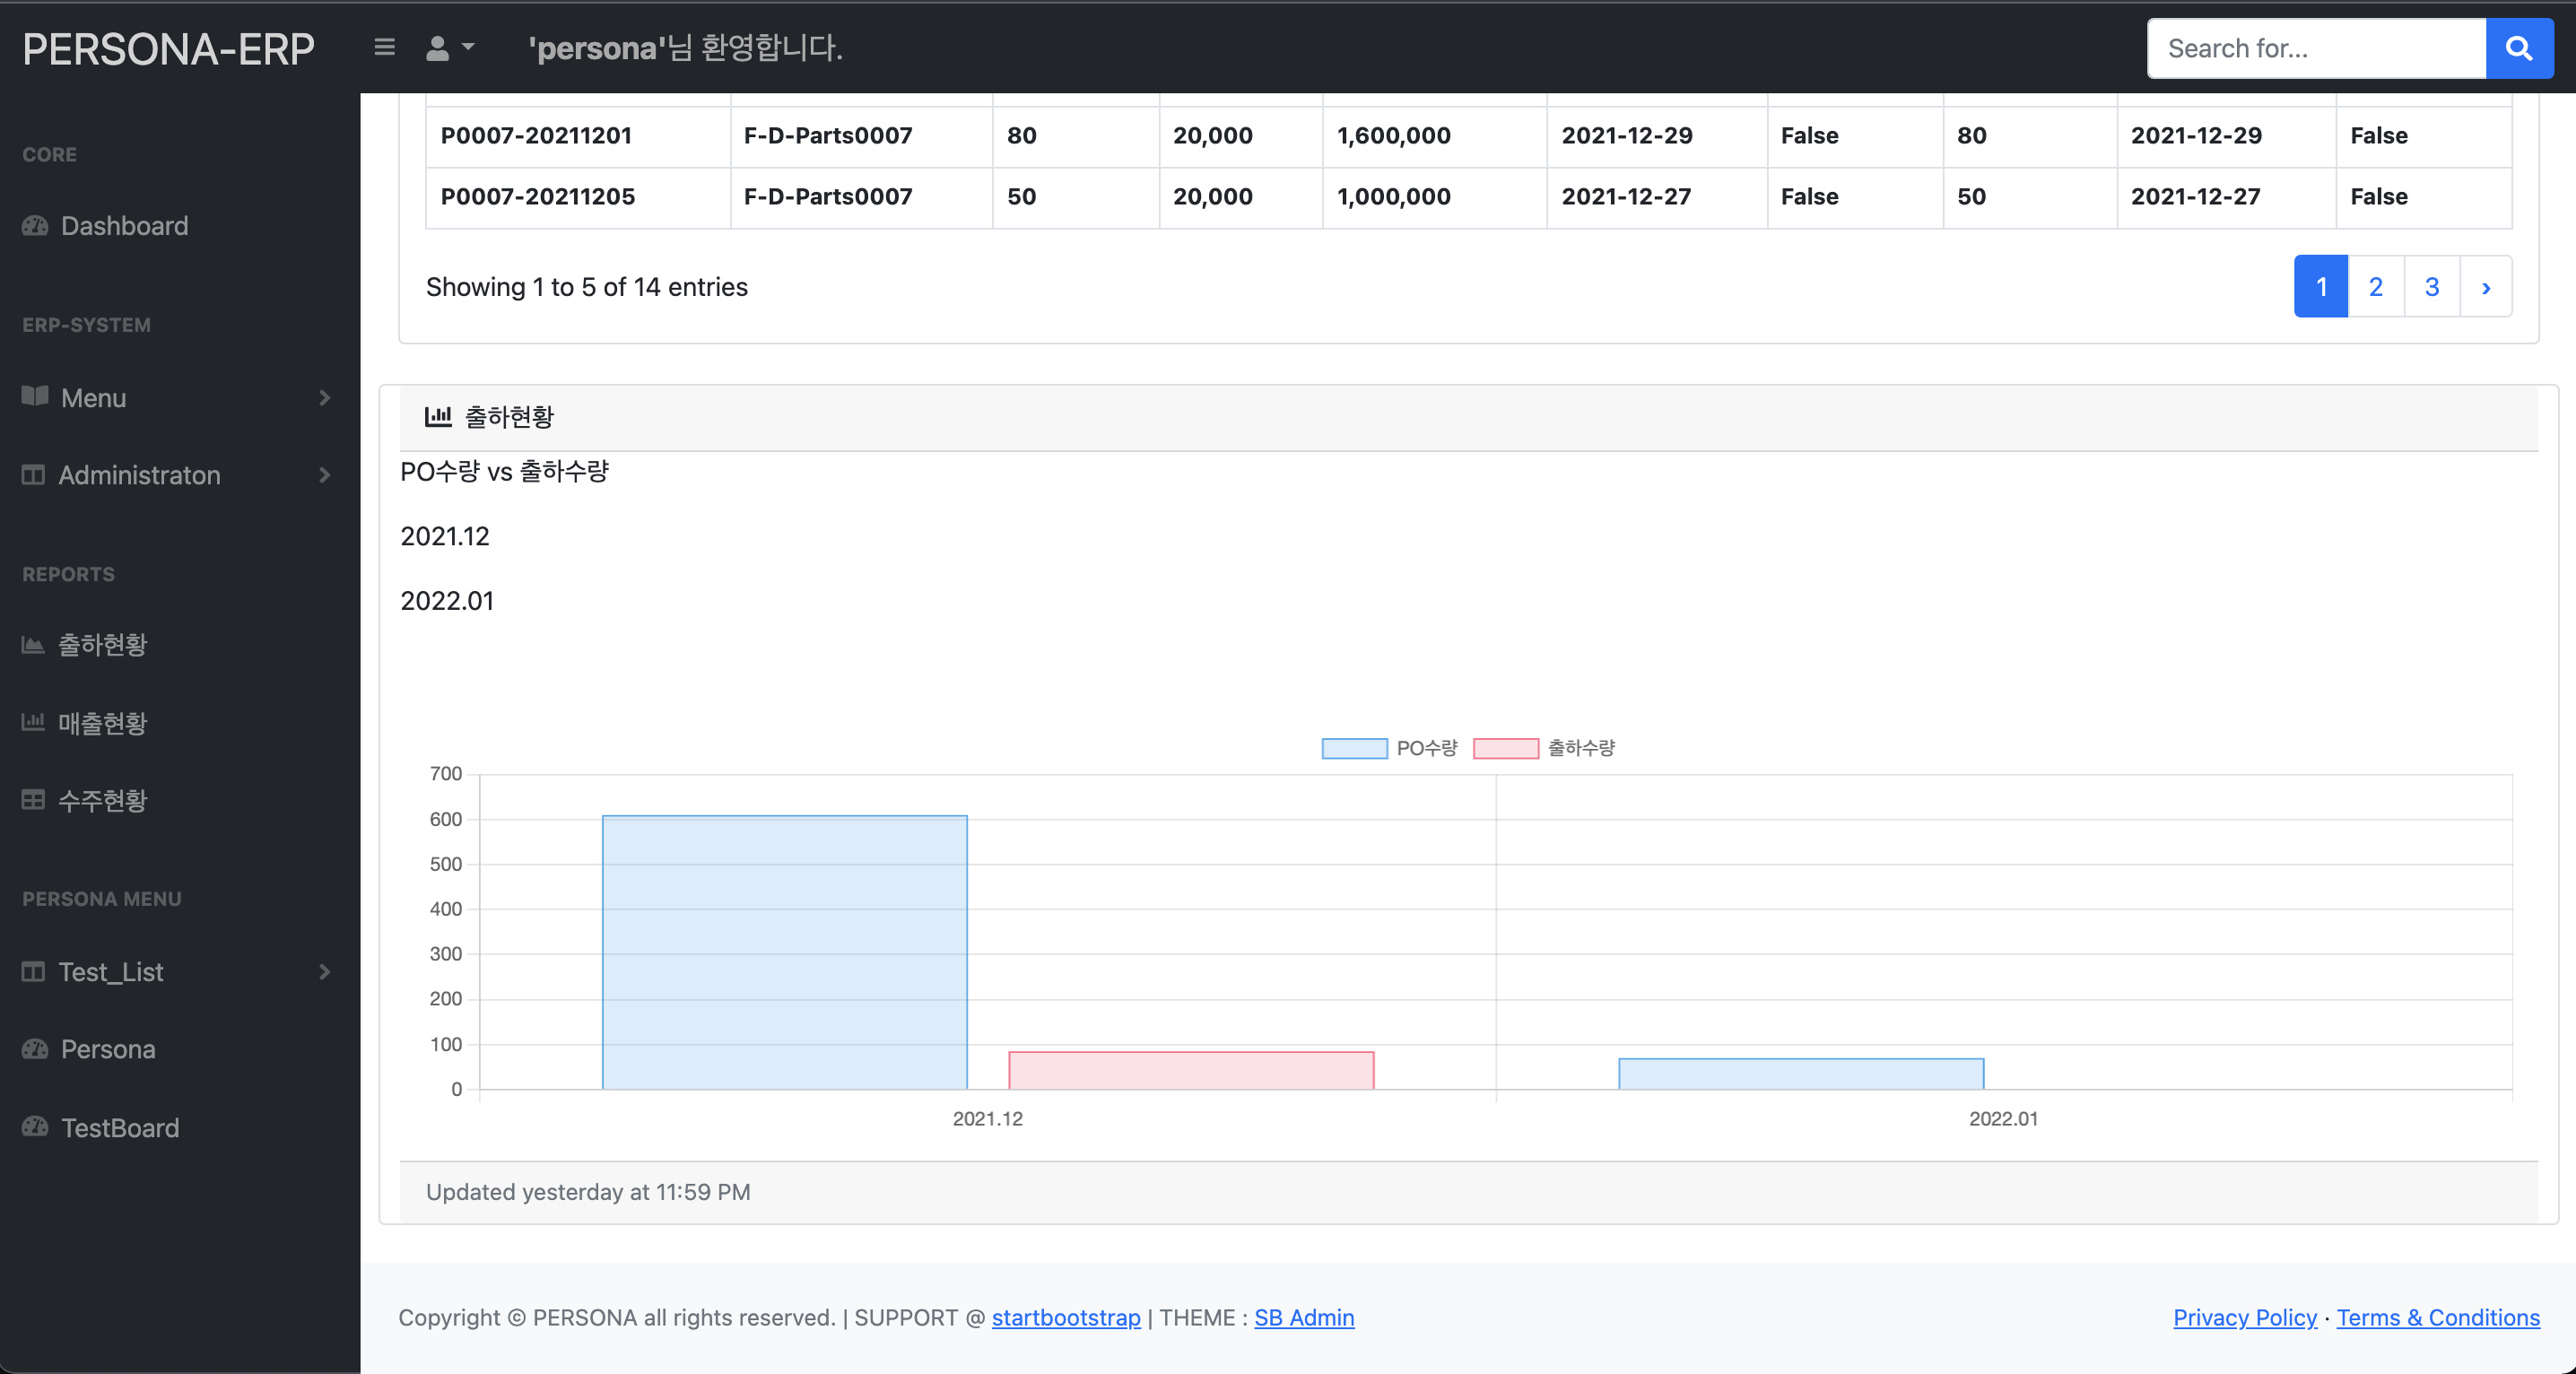
- localhost:8000/home/ship_status/ : 크게보기
--the end--
-----python coding-----------------------------------------------------------------------------------
링크 생성 및 수정
templates/base/sidebar.html
....
....
                <!-- Report part -->
                <div class="sb-sidenav-menu-heading">Reports</div>
                    <a class="nav-link" href="{% url 'home:ship_status' %}">
                        <div class="sb-nav-link-icon"><i class="fas fa-chart-area"></i></div>
                        출하현황
                    </a>
                    <a class="nav-link" href="#">
                        <div class="sb-nav-link-icon"><i class="fas fa-chart-bar"></i></div>
                        매출현황
                    </a>
                    <a class="nav-link" href="#">
                        <div class="sb-nav-link-icon"><i class="fas fa-table"></i></div>
                        수주현황
                    </a>

                    <div class="sb-sidenav-menu-heading">Persona Menu</div>
                    <a class="nav-link collapsed" href="#" data-bs-toggle="collapse" data-bs-target="#collapsePersonaTest" aria-expanded="false" aria-controls="collapsePersonaTest">
                        <div class="sb-nav-link-icon"><i class="fas fa-columns"></i></div>
                        Test_List
                        <div class="sb-sidenav-collapse-arrow"><i class="fas fa-angle-down"></i></div>
                    </a>
                    <div class="collapse" id="collapsePersonaTest" aria-labelledby="headingOne" data-bs-parent="#sidenavAccordion">
                        <nav class="sb-sidenav-menu-nested nav">
                            <a class="nav-link" href="#"><i class="fas fa-chart-area"></i>charts_chartjs2.8</a>
                            <a class="nav-link" href="#"><i class="fas fa-chart-area"></i>chart_bar_chartjs3.6</a>
                            </a>
                        </nav>
                    </div>

                    <a class="nav-link" href="#">
                        <div class="sb-nav-link-icon"><i class="fas fa-tachometer-alt"></i></div>
                        Persona
                    </a>
                    <a class="nav-link" href="$">
                        <div class="sb-nav-link-icon"><i class="fas fa-tachometer-alt"></i></div>
                        TestBoard
                    </a>
                <!-- Report part End-->
....
....
home/urls.py
from django.urls import path
from home import views

app_name = 'home'

urlpatterns = [
    path('', views.index, name='index'),
    path('notice/', views.notice, name='notice'),
    path('notice_view/<int:pk>', views.notice_view, name='notice_view'),
    path('notice_new/', views.notice_new, name='notice_new'),
    path('notice_view/<int:pk>/edit', views.notice_edit, name='notice_edit'),
    path('notice_view/<int:pk>/delete', views.notice_delete, name='notice_delete'),

    path('ship_status/', views.ship_status, name='ship_status'),
]
Model
OrdersTest ORM 생성 후 ShipsTest에서 해당 order_num ORM의 ship_fin을 True로 수정
출하전 exp_data(예상출하수량)으로 ship_fin True인 출하 후 cur_data(출하완료수량)으로 구분하여 그래프 작성
model DB 다수 생성방법
View
home/views.py
from django.shortcuts import render
from django.contrib.auth.decorators import login_required
from sales.models import ShipsTest
from django.db.models import F


# Create your views here.
@login_required
def ship_status(request):
	# orm -> tuple
	mrg_fk_datas = ShipsTest.objects.values_list('order_num__order_num', 'order_num__pdt_name', 'order_num__pdt_qnt', 'order_num__pdt_uprice', 'order_num__ship_date', 'order_num__ship_stat', 'ship_qnt', 'ship_rdate', 'ship_fin').order_by('-order_num')
	mrg_datas = mrg_fk_datas.annotate(ttl = F('order_num__pdt_qnt') * F('order_num__pdt_uprice'))

	title = 'PO수량 vs 출하수량'
	labels = ['2021.12','2022.01']
	cur_data_12 = []
	cur_data_1 = []
	exp_data_12 = []
	exp_data_1 = []
	for data in mrg_datas:
		if data[7].month == 12:
			exp_data_12.append(data[6])
			if data[8] == True:
				cur_data_12.append(data[6])
		else:
			exp_data_1.append(data[6])
			if data[8] == True:
				cur_data_1.append(data[6])
	ttls = [sum(exp_data_12), sum(exp_data_1), sum(cur_data_12), sum(cur_data_1)]
	# print(exp_data_12, cur_data_12)
	# print(exp_data_1, cur_data_1)

	datas = {'title':title, 'labels':labels, 'ttls_12':ttls[0:2], 'ttls_1':ttls[2:4]}
	# print(type(datas), datas)

	context = {'mrg_datas':mrg_datas, 'datas':datas}
	return render(request, 'home/reports/ship_status.html', context)
Template
home/templates/home/reports 폴더 생성하기
home/templates/home/reports/ship_status.html
{% extends 'base/base.html' %}
{% load humanize %}
{% block main %}
<div class="container-fluid px-4">
    <!-- Main_Header -->
    <h1 class="mt-4">출하현황</h1>
    <ol class="breadcrumb mb-4">
        <li class="breadcrumb-item"><a href="{% url 'home:ship_status' %}">Ship_Status</a></li>
    </ol>

    <!-- Main_content_#1 -->
    <div class="card mb-4">
        <div class="card-header">
            <i class="fas fa-table me-1"></i>
            출하현황 리스트
        </div>
        <div class="card-body">
            <table id="datatablesSimple">
                <thead>
                    <tr>
                        <th>PO번호</th>
                        <th>제품명</th>
                        <th>PO수량</th>
                        <th>단가</th>
                        <th>TTL_price</th>
                        <th>출하예정일</th>
                        <th>출하대기</th>
                        <th>출하수량</th>
                        <th>출하일</th>
                        <th>출하상태</th>
                    </tr>
                </thead>
                <tbody>
                {% for mrg_data in mrg_datas %}
                    <tr>
                        <th>{{ mrg_data.0 }}</th>
                        <th>{{ mrg_data.1 }}</th>
                        <th>{{ mrg_data.2 }}</th>
                        <th>{{ mrg_data.3 | intcomma }}</th>
                        <th>{{ mrg_data.9 | intcomma }}</th>
                        <th>{{ mrg_data.4 | date:'Y-m-d' }}</th>
                        <th>{{ mrg_data.5 }}</th>
                        <th>{{ mrg_data.6 }}</th>
                        <th>{{ mrg_data.7 | date:'Y-m-d' }}</th>
                        <th>{{ mrg_data.8 }}</th>
                    </tr>
                {% endfor %}
                </tbody>
            </table>
        </div>
    </div>
    <!-- Main_content_#2 -->
    <div class="row">
        <div class="card mb-4">
            <div class="card-header">
                <i class="fas fa-chart-bar me-1"></i>
                출하현황
            </div>
            <p>{{ datas.title }}</p>
            <p>{{ datas.labels.0 }}</p>
            <p>{{ datas.labels.1 }}</p>
            <p>{{ datas.ttls_exp }}</p>
            <p>{{ datas.ttls_cur }}</p>
            <div class="card-body"><canvas id="ship_status_bar" style="height:30vh; width:80vw"></canvas></div>
            <div class="card-footer small text-muted">Updated yesterday at 11:59 PM</div>
        </div>
    </div>
    <!-- Main_content_#3 -->

    <!-- Main_content_#4 -->
</div>
{% endblock main %}


{% load static %}
{% block js %}
    <script src="{% static 'js/chart36.min.js' %}"></script>
    <script type="text/javascript">
        // 전역변수 지정, .js 에서 template tag {{ }} 적용 안됨
        // .js 파일 미사용 시 여기 <script></script> 바로 적용 가능
        const label_glb = [{% for label in datas.labels %} '{{ label }}', {% endfor %}];
        const dates_glb_0 = [{% for ttl in datas.ttls_12 %} '{{ ttl }}', {% endfor %}];
        const dates_glb_1 = [{% for ttl in datas.ttls_1 %} '{{ ttl }}', {% endfor %}];
    </script>
    <script src="{% static 'js/ship_status_bar.js' %}"></script>
{% endblock js %}
Chart.js 그래프 그리기
Javascript
statics/js/ship_status_bar.html
var ctx = document.getElementById('ship_status_bar');
var myChart = new Chart(ctx, {
    // type: 'bar',
    data: {
        labels: label_glb,
        datasets: [
            {
            type: 'bar',
            label: 'PO수량',
            data: dates_glb_0,
            backgroundColor: [
                'rgba(54, 162, 235, 0.2)',
            ],
            borderColor: [
                'rgba(54, 162, 235, 1)',
            ],
            borderWidth: 1
            },
            {
            type: 'bar',
            label: '출하수량',
            data: dates_glb_1,
            backgroundColor: [
                'rgba(255, 99, 132, 0.2)',
            ],
            borderColor: [
                'rgba(255, 99, 132, 1)',
            ],
            borderWidth: 1
            }
        ]
    },
    options: {
        scales: {
            y: {
                beginAtZero: true
            }
        }
    }
});
반응형
'python > django_ERP2' 카테고리의 다른 글
| (macOS)[python] django-erp : chart - #1 chart.js 적용 (0) | 2021.12.18 |
|---|---|
| (macOS)[python] django-erp : Model - sales/customer (0) | 2021.12.08 |
| (macOS)[python] django-erp : accounts app 생성과 login, logout, signup 구현하기 (0) | 2021.12.08 |
| (macOS)[python] django-erp : templates 구조 정리 - 2 (0) | 2021.12.08 |
| (macOS)[python] django-erp : templates 구조 정리 - 1 (0) | 2021.12.08 |
댓글
공지사항
최근에 올라온 글
최근에 달린 댓글
- Total
- Today
- Yesterday
링크
TAG
- github
- template
- DS18B20
- 자가격리
- pyserial
- 확진
- CSV
- 코로나19
- sublime text
- server
- SSH
- Django
- DAQ
- arduino
- raspberrypi
- Pandas
- Raspberry Pi
- Model
- Regression
- vscode
- MacOS
- COVID-19
- Python
- Templates
- 라즈베리파이
- analysis
- git
- 코로나
- ERP
- r
| 일 | 월 | 화 | 수 | 목 | 금 | 토 |
|---|---|---|---|---|---|---|
| 1 | 2 | 3 | ||||
| 4 | 5 | 6 | 7 | 8 | 9 | 10 |
| 11 | 12 | 13 | 14 | 15 | 16 | 17 |
| 18 | 19 | 20 | 21 | 22 | 23 | 24 |
| 25 | 26 | 27 | 28 | 29 | 30 | 31 |
글 보관함