Arduino
(mintOS)[python] Arduino DS18B20 방수 온도 센서 DAQ Monitoring with tkinter
jinozpersona
2022. 11. 18. 09:26
Intro
OS : Linux Mint 21 Vanessa, Cinnamon 5.3
HW : Arduino UNO R3 board, DS18B20 방수 온도 센서 2ea
SW : Visual Studio Code, so-called vscode
python : 3.10.6
- Arduino 연결 부터 확인하려면 다음 포스트 참고
Arduino UNO DHT11 sensor 연결 및 모니터링
- Arduino Sensor DAQ 확인하려면 다음 포스트 참고
- Arduino Sensor multi DAQ 확인하려면 다음 포스트 참고
Arduino UNO DHT11/LM35 sensor multi DAQ
Requirements
- vscode
- vscode extension : Arduino
- python library
pyserial
numpy
tkinter
matplotlib
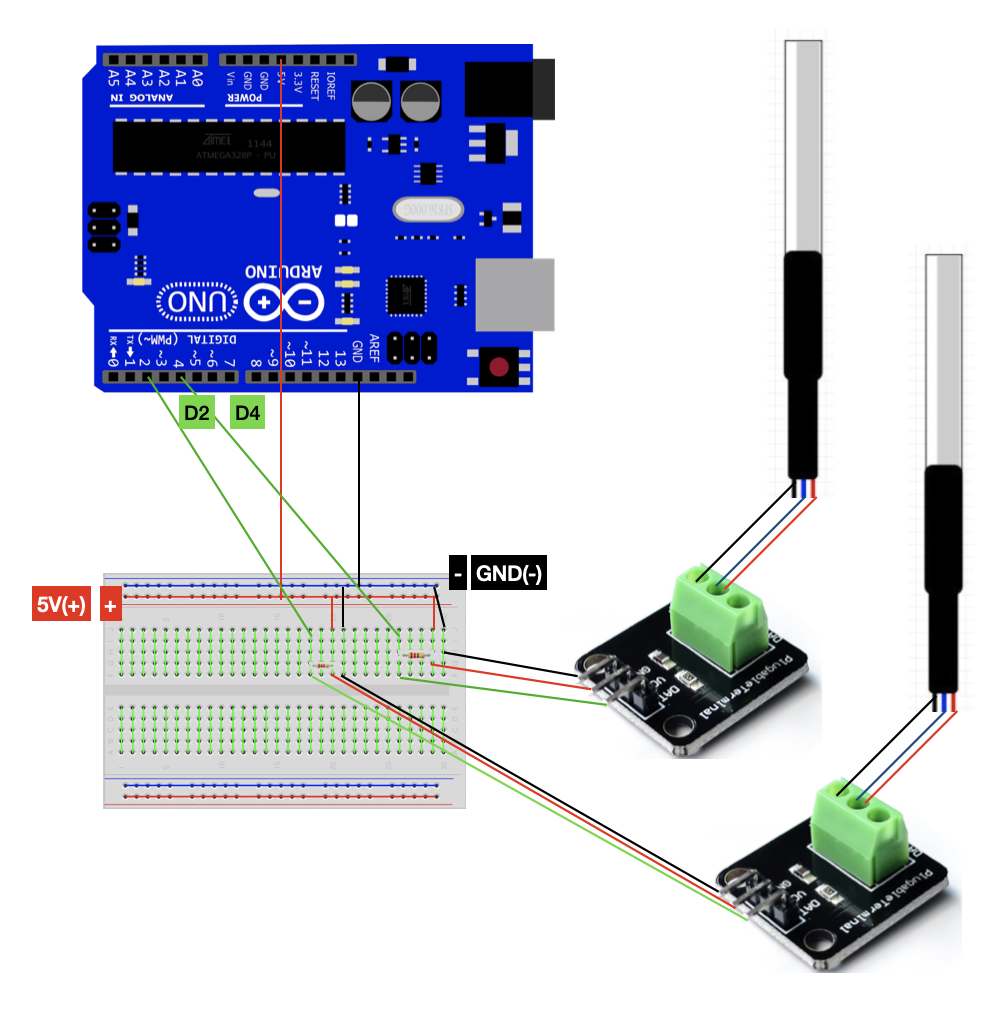
Arduino UNO R3 : DS18B20 Sensor 4.7k pull-up 저항 연결도
1. Arduino: Initialize
2. Arduino: Library Manager
# 참고 : (macOS)[python] pyserial을 이용한 Arduino UNO R3 제어 with vscode - 2/2
3. Arduino Coding & Upload
ard_ds18b20.ino
#include <OneWire.h>
#include <DallasTemperature.h>

#define ONE_WIRE_BUS_1 2
#define ONE_WIRE_BUS_2 4

OneWire Wire_1(ONE_WIRE_BUS_1);
OneWire Wire_2(ONE_WIRE_BUS_2);

DallasTemperature sensor1(&Wire_1);
DallasTemperature sensor2(&Wire_2);

// arduino board
int baudrate = 9600;

void setup() {
	Serial.begin(baudrate);
	sensor1.begin();
	sensor2.begin();
}

void loop()
{
	sensor1.requestTemperatures();
	sensor2.requestTemperatures();
	Serial.print(sensor1.getTempCByIndex(0));
	Serial.println(sensor2.getTempCByIndex(0));
	delay(1000);
}
$ arduino-cli board list
mintOS에서 다음 serial port가 확인되지만 실행이 되지 않는다.
/dev/ttyACM0
다음과 같이 권한을 부여하고 vscode를 재실행한다.
$ sudo chmod a+rw /dev/ttyACM0
Open Serial Monitor를 실행하면 2개의 데이터를 얻을 수 있다.
4. python Code : 이전 포스트 code 일부 수정
persona_daq.py
import os
import serial
import numpy as np
import time
import tkinter as tk
import matplotlib.pyplot as plt
import matplotlib.animation as animation


## initial params.
global ard, sw, y_sum
sw = 1
y_sum = np.empty((0,2), dtype=float)
save_data = np.empty((0,4))

## arduino board set-up
serial_port = '/dev/ttyACM0'
serial_baudrate = 9600
ard = serial.Serial(serial_port,serial_baudrate)
for tt in range(5,0,-1):
	test_raw = ard.readline()
	test = test_raw.decode()[:len(test_raw)-2]
	print("starting...#{} | testing....:{} ".format(tt,test))
	time.sleep(1)

## initial tkinter graph
fig = plt.figure()
ax = fig.add_subplot(1,1,1)
ax.set_xlim([0,10])
ax.set_ylim([0,100])


## daq_ard plot function : Data AcQuisition from Arduino Board
def daq_ard(i):
	global ard, sw, y_sum, save_data
	if(sw == 1):
		td = time.strftime('%Y-%m-%d', time.localtime())
		tt = time.strftime('%H:%M:%S', time.localtime())
		datas_raw = ard.readline()
		## ard.decode() : readline을 decoding
		datas = datas_raw.decode()[:len(datas_raw)-2]
		print('Decoded data:{}, type:{}:'.format(datas,type(datas)))
		T1S1 = float(datas[0:5])
		T2S2 = float(datas[5:10])
		y_new = np.array([[T1S1,T2S2]])
		print(y_new[0],type(y_new[0]))
		print('y_new(float):{}, type:{}'.format(y_new,type(y_new)))
		y_sum = np.append(y_sum,y_new,axis=0)
		print('DAQ count: {}'.format(len(y_sum)))
		print('Data Stack: T1S1  T2S2\n{}'.format(y_sum))

		## axes clear/limit
		ax.clear()
		# ax.set_xlim([int(len(y_sum)-10),int(len(y_sum))])
		ax.set_xlim([int(0),int(len(y_sum)+2)])
		plt.xticks(range(0,len(y_sum),1))
		ax.set_ylim([0.0,100.0])

		## plot 2-datas from sensor 2EA,
		ax.plot([i for i in range(int(len(y_sum)))],y_sum[:,0],'ro-',label='Temp.1')
		ax.plot([i for i in range(int(len(y_sum)))],y_sum[:,1],'go-',label='Temp.2')

		## title/label
		ax.set_title('Temp. vs Time')
		ax.set(xlabel='Time[sec]',ylabel='Temp.[oC]')

		## legend/grid
		ax.legend(loc="upper left")
		plt.grid()

		databysave = np.array([[td,tt,y_new[0][0],y_new[0][1]]])
		save_data = np.append(save_data,databysave,axis=0)

	else:
		print("Please Push the START button")


#### tkinter loop
root = tk.Tk()
root_title = 'Temperature DAQ System'
root.title(root_title)
# win_size : width x height + x_position + y_position
root_size = '200x100+650+20'
root.geometry(root_size)
## .resizable : move (vertical, horizontal) True or False
root.resizable(False, False)


## stop btn
def save():
	print("Start Save....")
	global save_data
	spath = './save_daq'
	sname = 'data_save.csv'

	if not os.path.exists(spath):
		os.mkdir(spath)

	csv_rows = ["{},{},{},{}".format(i,j,k,l) for i,j,k,l in save_data]
	csv_text = "\n".join(csv_rows)
	with open(os.path.join(spath,sname), 'w') as cf:
		cf.write(csv_text)
	cf.close()
	for tt in range(3,0,-1):
		print("saving....#{} ".format(tt))
		time.sleep(1)
	print("save_path:{}{}".format(os.getcwd(),spath[1:]))
	print("Complete Save!!")

## stop btn
def stop():
	global ard, sw
	ard = None
	sw = 0
	print("stop")
	ax.clear()
	plt.close()
	root.destroy()

btn_save = tk.Button(root,text='SAVE',overrelief='groove',fg='blue',width=10,command=save,repeatdelay=1000,repeatinterval=100)
btn_save.pack()
btn_stop = tk.Button(root,text='STOP',overrelief='groove',fg='red',width=10,command=stop,repeatdelay=1000,repeatinterval=100)
btn_stop.pack()

anim = animation.FuncAnimation(fig,daq_ard,interval=1000)

plt.show()

root.mainloop()
#### tkinter loop
mint21 실행화면
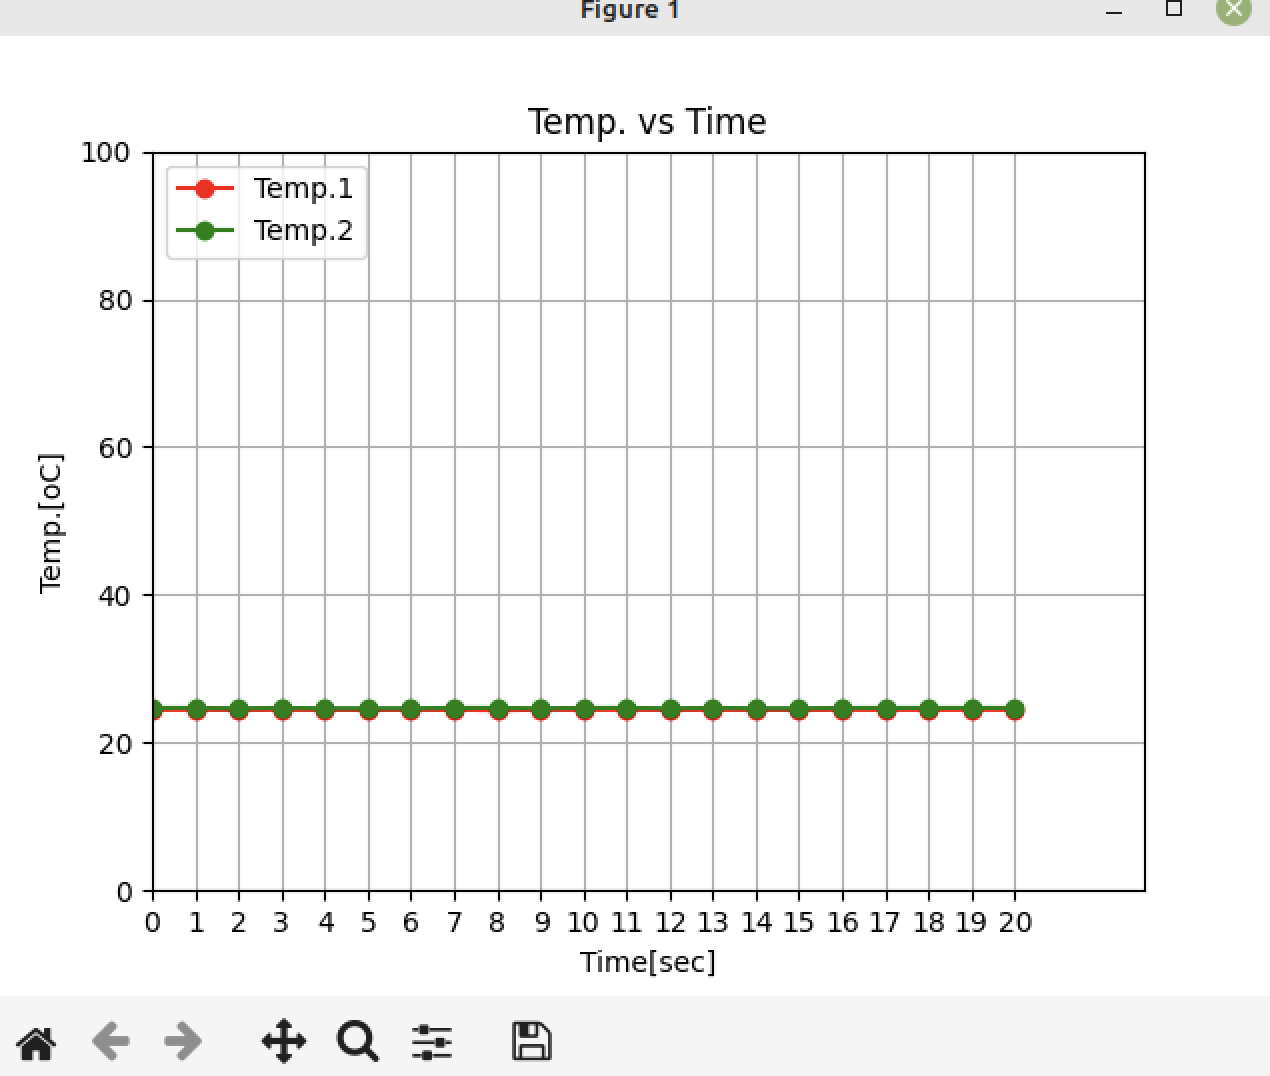
figure 창을 닫으면 저장/종료 생성
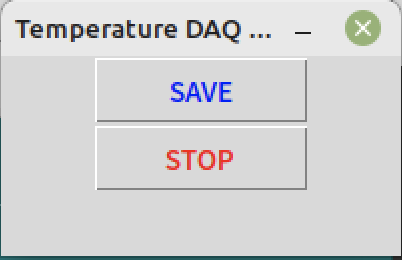
save 저장 후 데이터
| 2022-11-21 | 19:53:42 | 24.44 | 24.62 |
| 2022-11-21 | 19:53:43 | 24.44 | 24.62 |
| 2022-11-21 | 19:53:44 | 24.44 | 24.62 |
| 2022-11-21 | 19:53:45 | 24.44 | 24.62 |
| 2022-11-21 | 19:53:46 | 24.44 | 24.62 |
| 2022-11-21 | 19:53:47 | 24.37 | 24.62 |
| 2022-11-21 | 19:53:48 | 24.44 | 24.62 |
| 2022-11-21 | 19:53:49 | 24.44 | 24.69 |
| 2022-11-21 | 19:53:50 | 24.44 | 24.62 |
| 2022-11-21 | 19:53:51 | 24.44 | 24.62 |
| 2022-11-21 | 19:53:52 | 24.44 | 24.62 |
| 2022-11-21 | 19:53:53 | 24.44 | 24.69 |
| 2022-11-21 | 19:53:55 | 24.44 | 24.62 |
| 2022-11-21 | 19:53:56 | 24.44 | 24.62 |
| 2022-11-21 | 19:53:57 | 24.37 | 24.62 |
| 2022-11-21 | 19:53:58 | 24.44 | 24.62 |
| 2022-11-21 | 19:53:59 | 24.44 | 24.62 |
| 2022-11-21 | 19:54:00 | 24.44 | 24.62 |
| 2022-11-21 | 19:54:01 | 24.44 | 24.62 |
| 2022-11-21 | 19:54:02 | 24.44 | 24.62 |
| 2022-11-21 | 19:54:03 | 24.44 | 24.62 |
| 2022-11-21 | 19:54:04 | 24.37 | 24.69 |
| 2022-11-21 | 19:54:06 | 24.44 | 24.62 |
| 2022-11-21 | 19:54:07 | 24.44 | 24.62 |
| 2022-11-21 | 19:54:08 | 24.44 | 24.62 |
| 2022-11-21 | 19:54:09 | 24.44 | 24.62 |
| 2022-11-21 | 19:54:10 | 24.44 | 24.62 |
| 2022-11-21 | 19:54:11 | 24.44 | 24.69 |
| 2022-11-21 | 19:54:12 | 24.44 | 24.62 |
| 2022-11-21 | 19:54:14 | 24.44 | 24.62 |
| 2022-11-21 | 19:54:15 | 24.44 | 24.62 |
반응형