Arduino
(macOS)[python] Arduino DHT11/LM35 DAQ Monitoring with tkinter
jinozpersona
2022. 11. 14. 08:03
Intro
OS : MacOS, Ventura, v13.0.1
HW : Arduino UNO R3 board, DHT11 Sensor, LM35 Sensor
SW : Visual Studio Code, so-called vscode
python : 3.10.7
- Arduino 연결 부터 확인하려면 다음 포스트 참고
Arduino UNO DHT11 sensor 연결 및 모니터링
- Arduino Sensor DAQ 확인하려면 다음 포스트 참고
- Arduino Sensor multi DAQ 확인하려면 다음 포스트 참고
Arduino UNO DHT11/LM35 sensor multi DAQ
2종 multi sensor DAQ
DHT11 : Digital Output Sensor
LM35 : Analog Output Sensor
Requirements
- vscode
- vscode extension : Arduino
- python library
pyserial
numpy
tkinter
matplotlib
Arduino UNO R3 : DHT11/LM35 Sensor 연결도
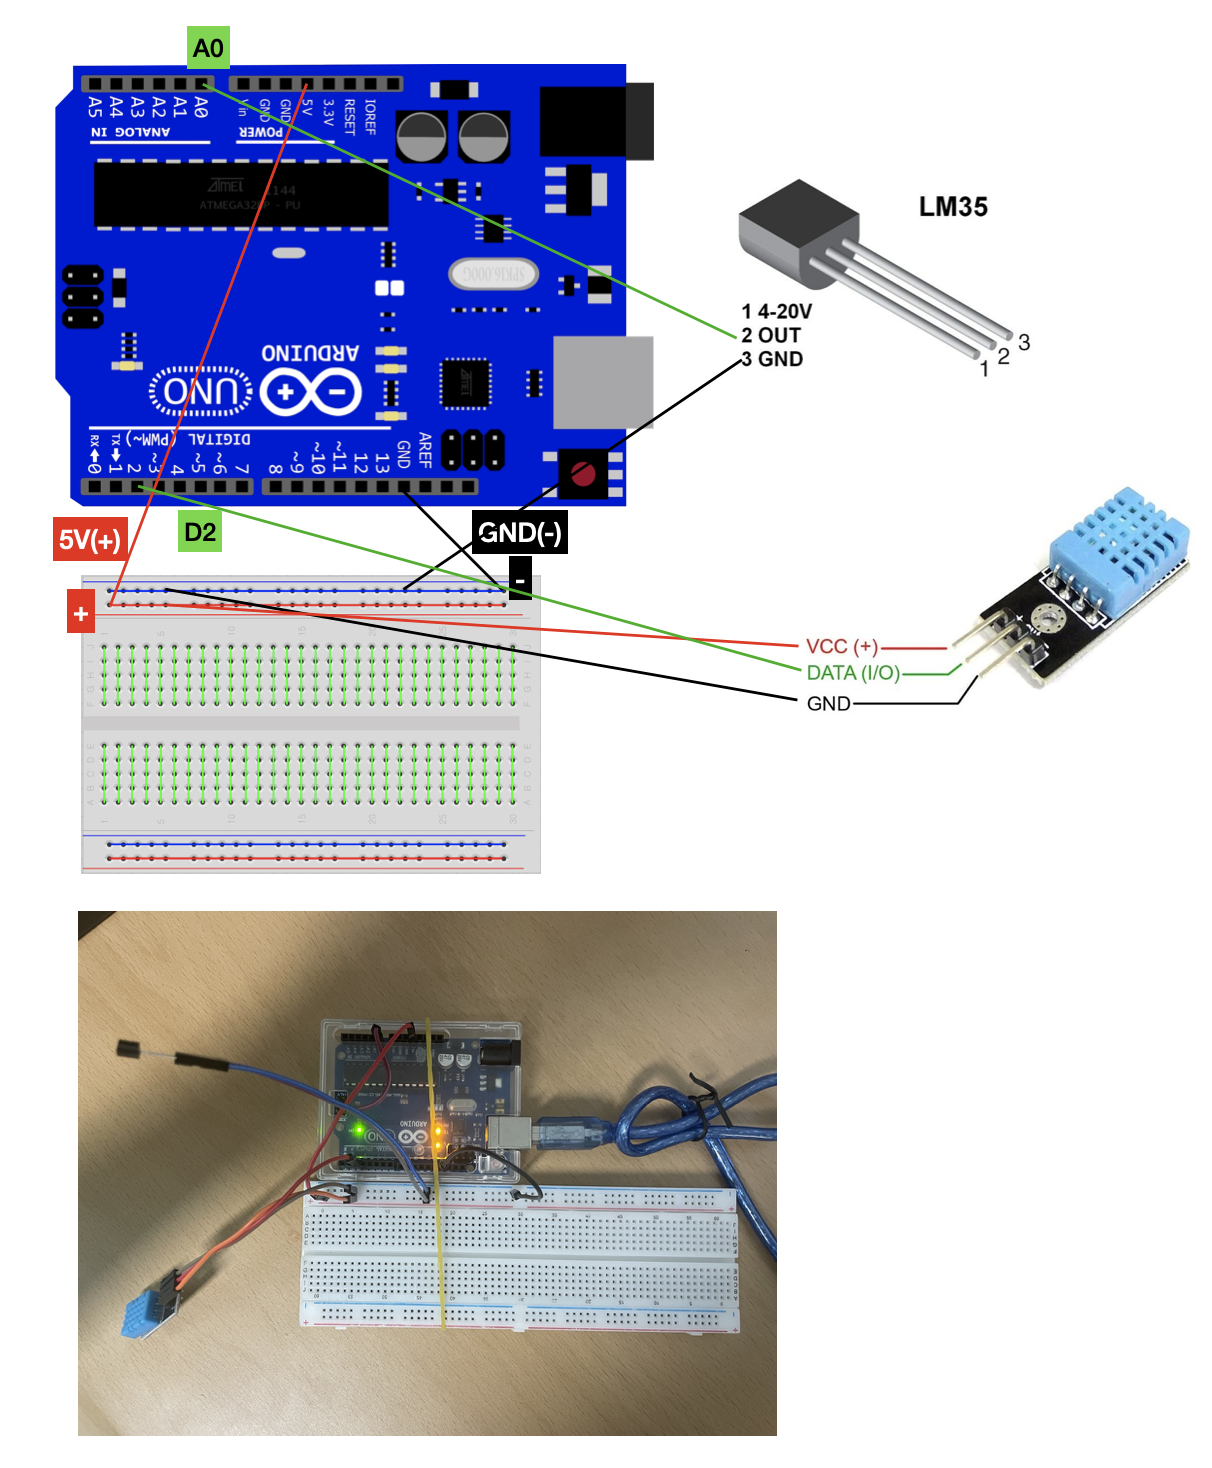
1. Arduino: Initialize
2. Arduino: Library Manager
# 참고 : (macOS)[python] pyserial을 이용한 Arduino UNO R3 제어 with vscode - 2/2
3. Arduino Coding & Upload
ard_tkinter_dht11_lm35.ino
// DHT11 Sensor
#include <DHT_U.h>
#include <DHT.h>

#define DHTPIN 2
#define DHTTYPE DHT11   // DHT 11
DHT dht(DHTPIN, DHTTYPE);

// LM35 Sensor
int value;
int Vin = 5;

// arduino board
int baudrate = 9600;

void setup() {
	Serial.begin(baudrate);
	dht.begin();
}

void loop(){
	// DHT
	float dht_h = dht.readHumidity();
	float dht_t = dht.readTemperature();
	if (isnan(dht_h) || isnan(dht_t)) {
    	Serial.println(F("Failed to read from DHT sensor!"));
    	return;
	}

	Serial.print(dht_h);
	// Serial.println(dht_t);
	Serial.print(dht_t);

	// LM35
	value = analogRead(0);
	float lm_t = ( value/1024.0)*Vin*100;

	Serial.println(lm_t);

	delay(1000);
}
Arduino: Verify
Arduino: Upload
4. python Coding & DAQ
persona_daq.py
import os
import serial
import numpy as np
import time
import tkinter as tk
import matplotlib.pyplot as plt
import matplotlib.animation as animation


## initial params.
global ard, sw, y_sum
sw = 0
y_sum = np.empty((0,3), dtype=float)
save_data = np.empty((0,5))

## initial tkinter graph
fig = plt.figure()
ax1 = fig.add_subplot(1,1,1)
ax2 = ax1.twinx()
ax1.set_xlim([0,10])
ax1.set_ylim([0,100])
ax2.set_ylim([0,70])


## daq_ard plot function : Data AcQuisition from Arduino Board
def daq_ard(i):
	global sw, y_sum, save_data
	if(sw == 1):
		td = time.strftime('%Y-%m-%d', time.localtime())
		tt = time.strftime('%H:%M:%S', time.localtime())
		datas_raw = ard.readline()
		## ard.decode() : readline을 decoding
		datas = datas_raw.decode()[:len(datas_raw)-2]
		print('Decoded data:{}, type:{}:'.format(datas,type(datas)))
		T1S1 = float(datas[5:10])
		T2S2 = float(datas[10:15])
		H1S1 = float(datas[0:5])
		y_new = np.array([[T1S1,T2S2,H1S1]])
		print(y_new[0],type(y_new[0]))
		print('y_new(float):{}, type:{}'.format(y_new,type(y_new)))
		y_sum = np.append(y_sum,y_new,axis=0)
		print('DAQ count: {}'.format(len(y_sum)))
		print('Data Stack: T1S1  T2S2  HumS1\n{}'.format(y_sum))

		## axes clear/limit
		ax1.clear()
		ax2.clear()
		# ax1.set_xlim([int(len(y_sum)-10),int(len(y_sum))])
		ax1.set_xlim([int(0),int(len(y_sum)+2)])
		plt.xticks(range(0,len(y_sum),1))
		ax1.set_ylim([0.0,100.0])
		ax2.set_ylim([0.0,70.0])

		## plot 3-datas from sensor 2EA,
		ax1.plot([i for i in range(int(len(y_sum)))],y_sum[:,0],'ro-',label='Temp.1')
		ax1.plot([i for i in range(int(len(y_sum)))],y_sum[:,1],'go-',label='Temp.2')
		ax2.plot([i for i in range(int(len(y_sum)))],y_sum[:,2],'b*--',label='Humidity')

		## title/label
		ax1.set_title('Temp. vs Time')
		ax1.set(xlabel='Time[sec]',ylabel='Temp.[oC]')

		## legend/grid
		ax1.legend(loc="upper left")
		ax2.legend(loc="upper right")
		plt.grid()

		databysave = np.array([[td,tt,y_new[0][0],y_new[0][1],y_new[0][2]]])
		save_data = np.append(save_data,databysave,axis=0)

	else:
		print("Please Push the START button")


#### tkinter loop
root = tk.Tk()
root_title = 'Temperature DAQ System'
root.title(root_title)
# win_size : width x height + x_position + y_position
root_size = '200x100+700+50'
root.geometry(root_size)
## .resizable : move (vertical, horizontal) True or False
root.resizable(False, False)

## start btn : Arduino set-up
def start():
	global ard, sw
	## arduino board set-up
	serial_port = '/dev/tty.usbmodem141101'
	serial_baudrate = 9600
	ard = serial.Serial(serial_port,serial_baudrate)
	print("start")
	sw = 1
	time.sleep(1)


## stop btn
def stop():
	global ard, sw, save_data
	ard = None
	sw = 0
	print("stop")
	fname = 'data_save.csv'
	if os.path.exists(fname):
		os.remove(fname)

	csv_rows = ["{},{},{},{},{}".format(i,j,k,l,m) for i,j,k,l,m in save_data]
	csv_text = "\n".join(csv_rows)

	with open(fname, 'w') as cf:
		cf.write(csv_text)
	cf.close
	ax1.clear()
	ax2.clear()

btn_start = tk.Button(root,text='START',overrelief='groove',fg='black',width=10,command=start,repeatdelay=1000,repeatinterval=100)
btn_start.pack()
btn_stop = tk.Button(root,text='STOP',overrelief='groove',fg='red',width=10,command=stop,repeatdelay=1000,repeatinterval=100)
btn_stop.pack()

anim = animation.FuncAnimation(fig,daq_ard,interval=1000)

plt.show()

root.mainloop()
#### tkinter loop
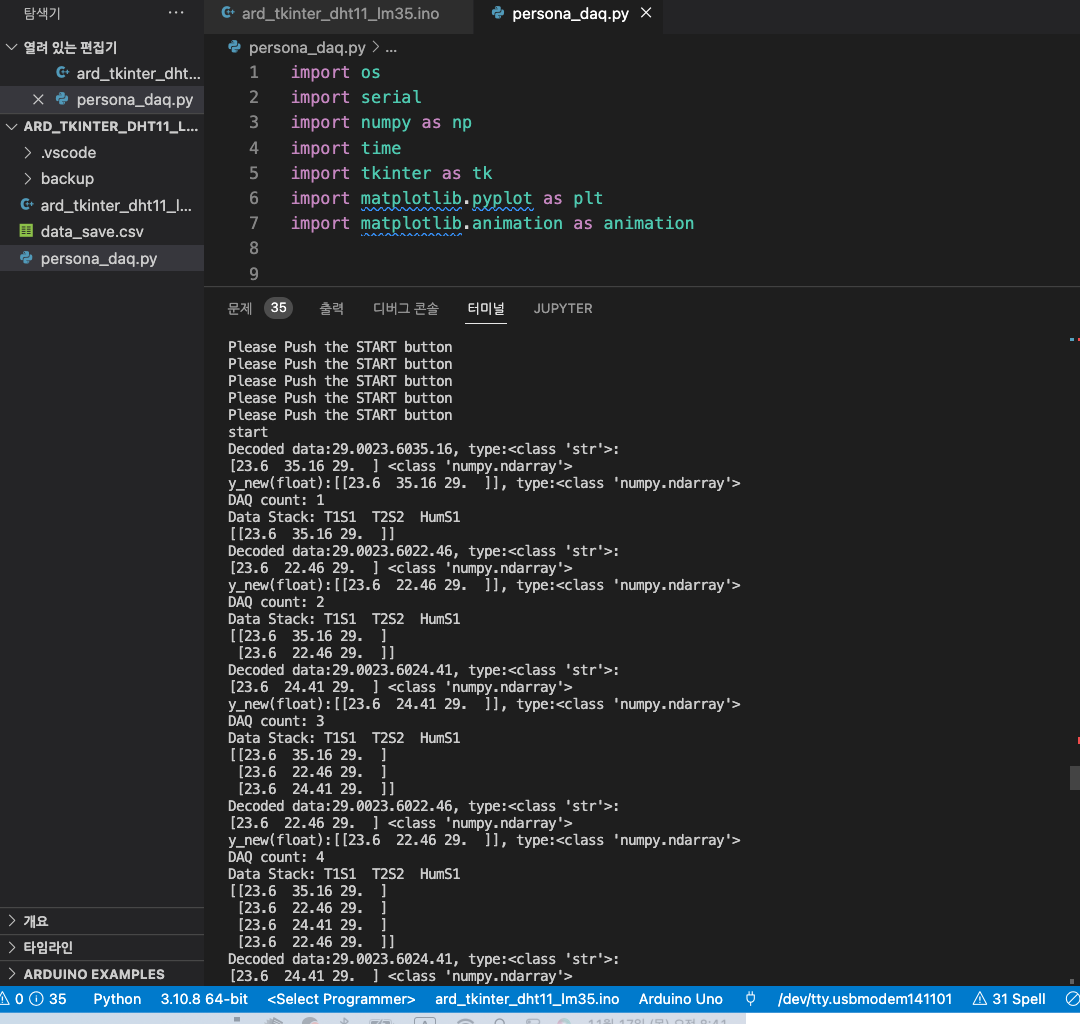
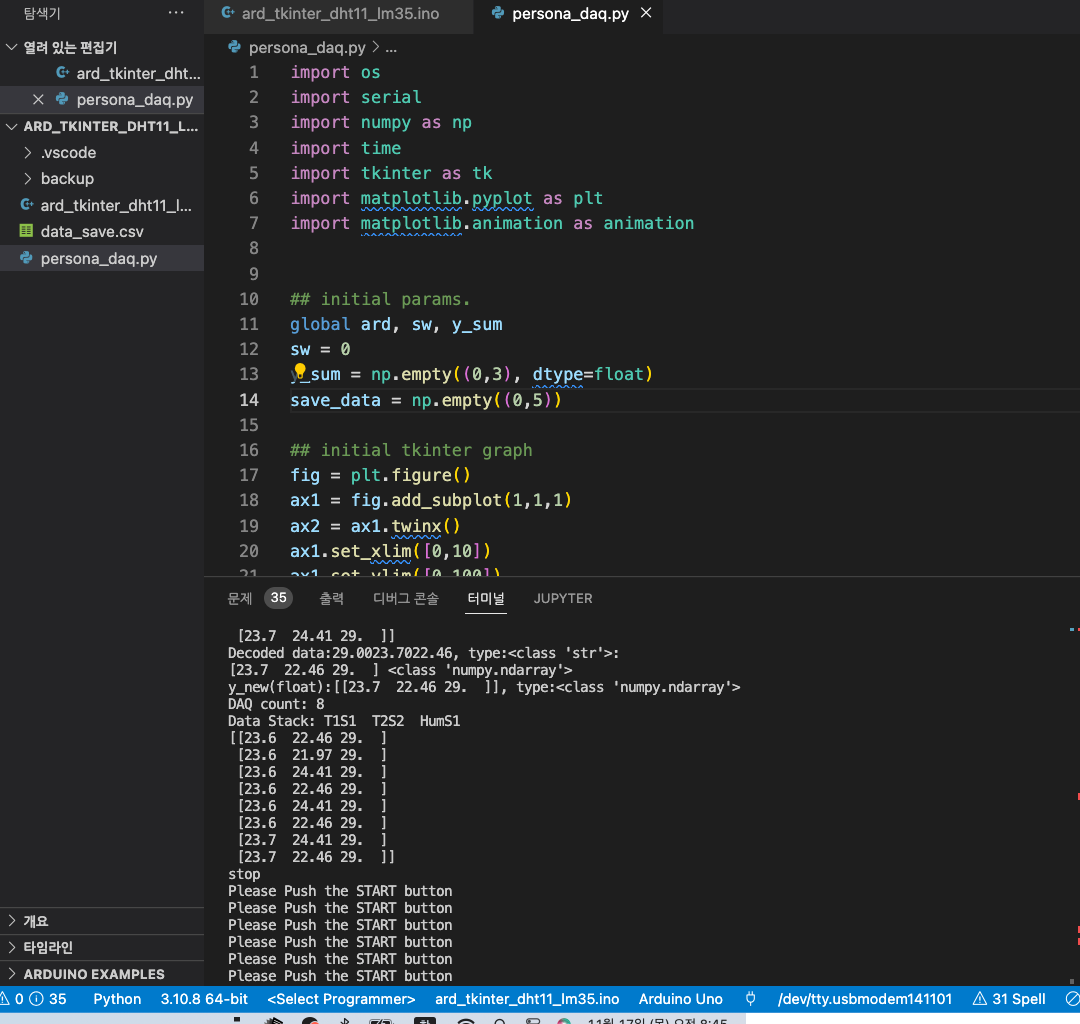
# 참고 : python Terminal 실행창
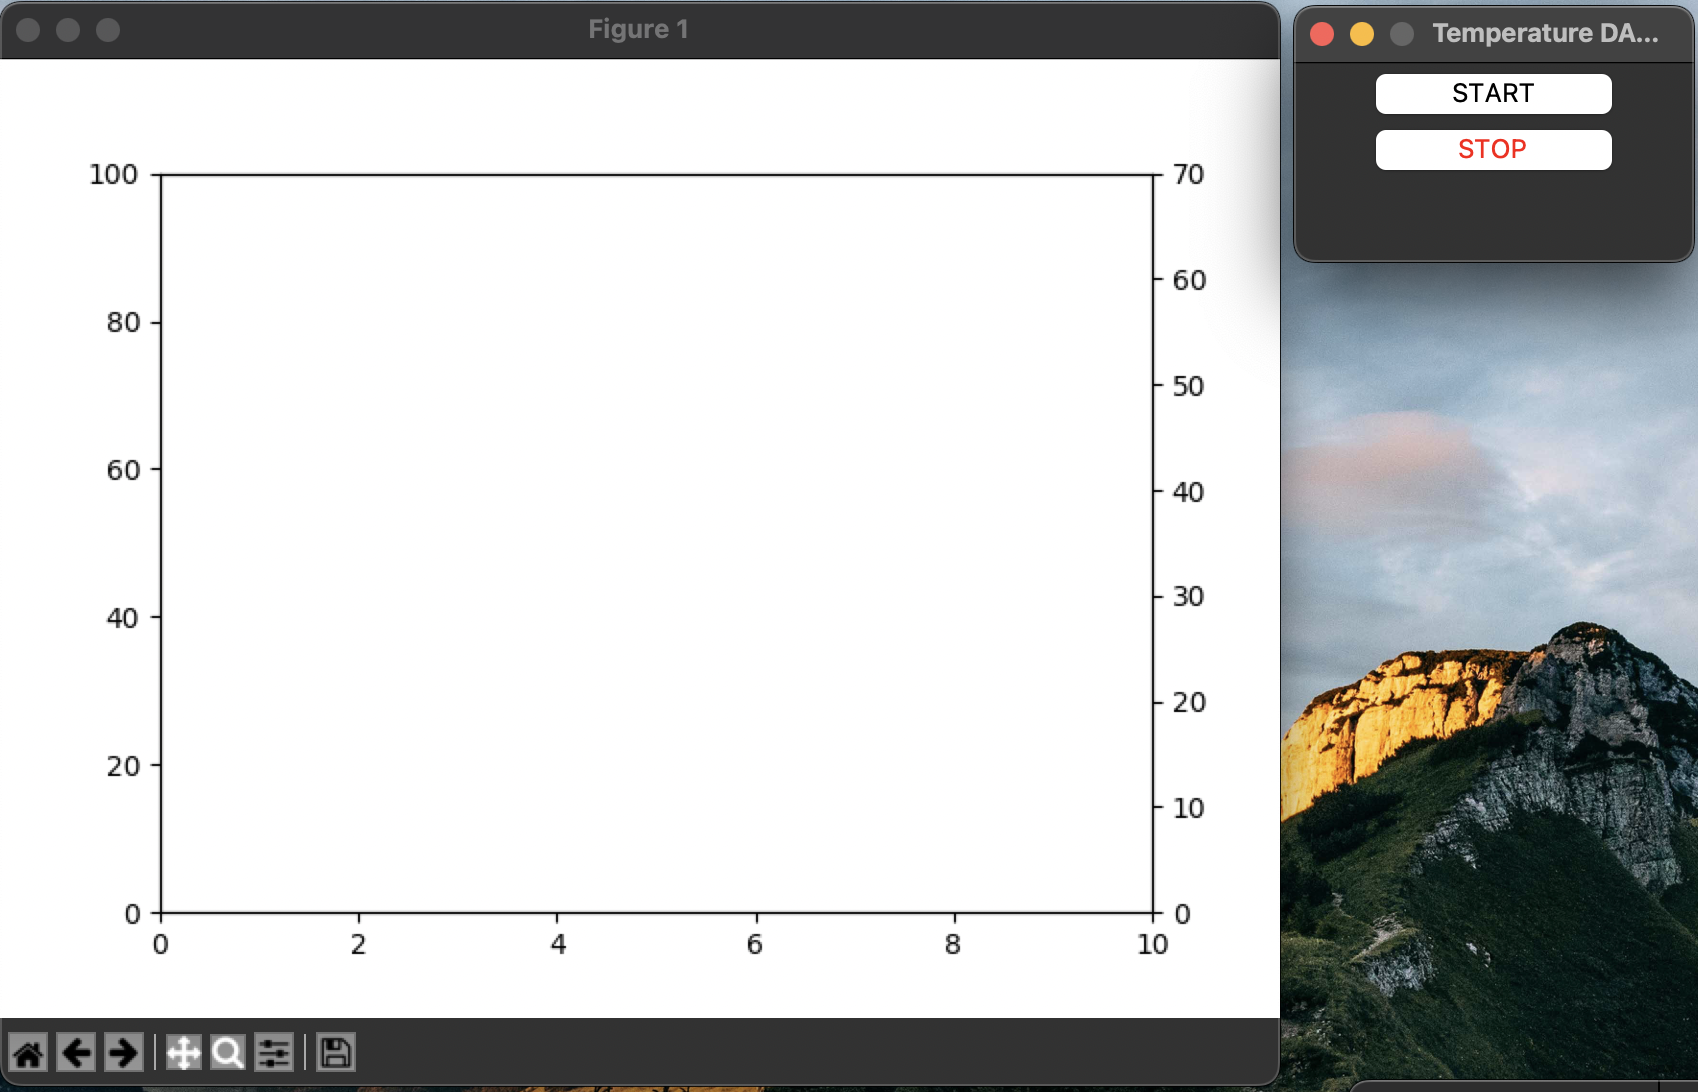
# 참고 : tkinter/figure 실행창
- 초기 실행창
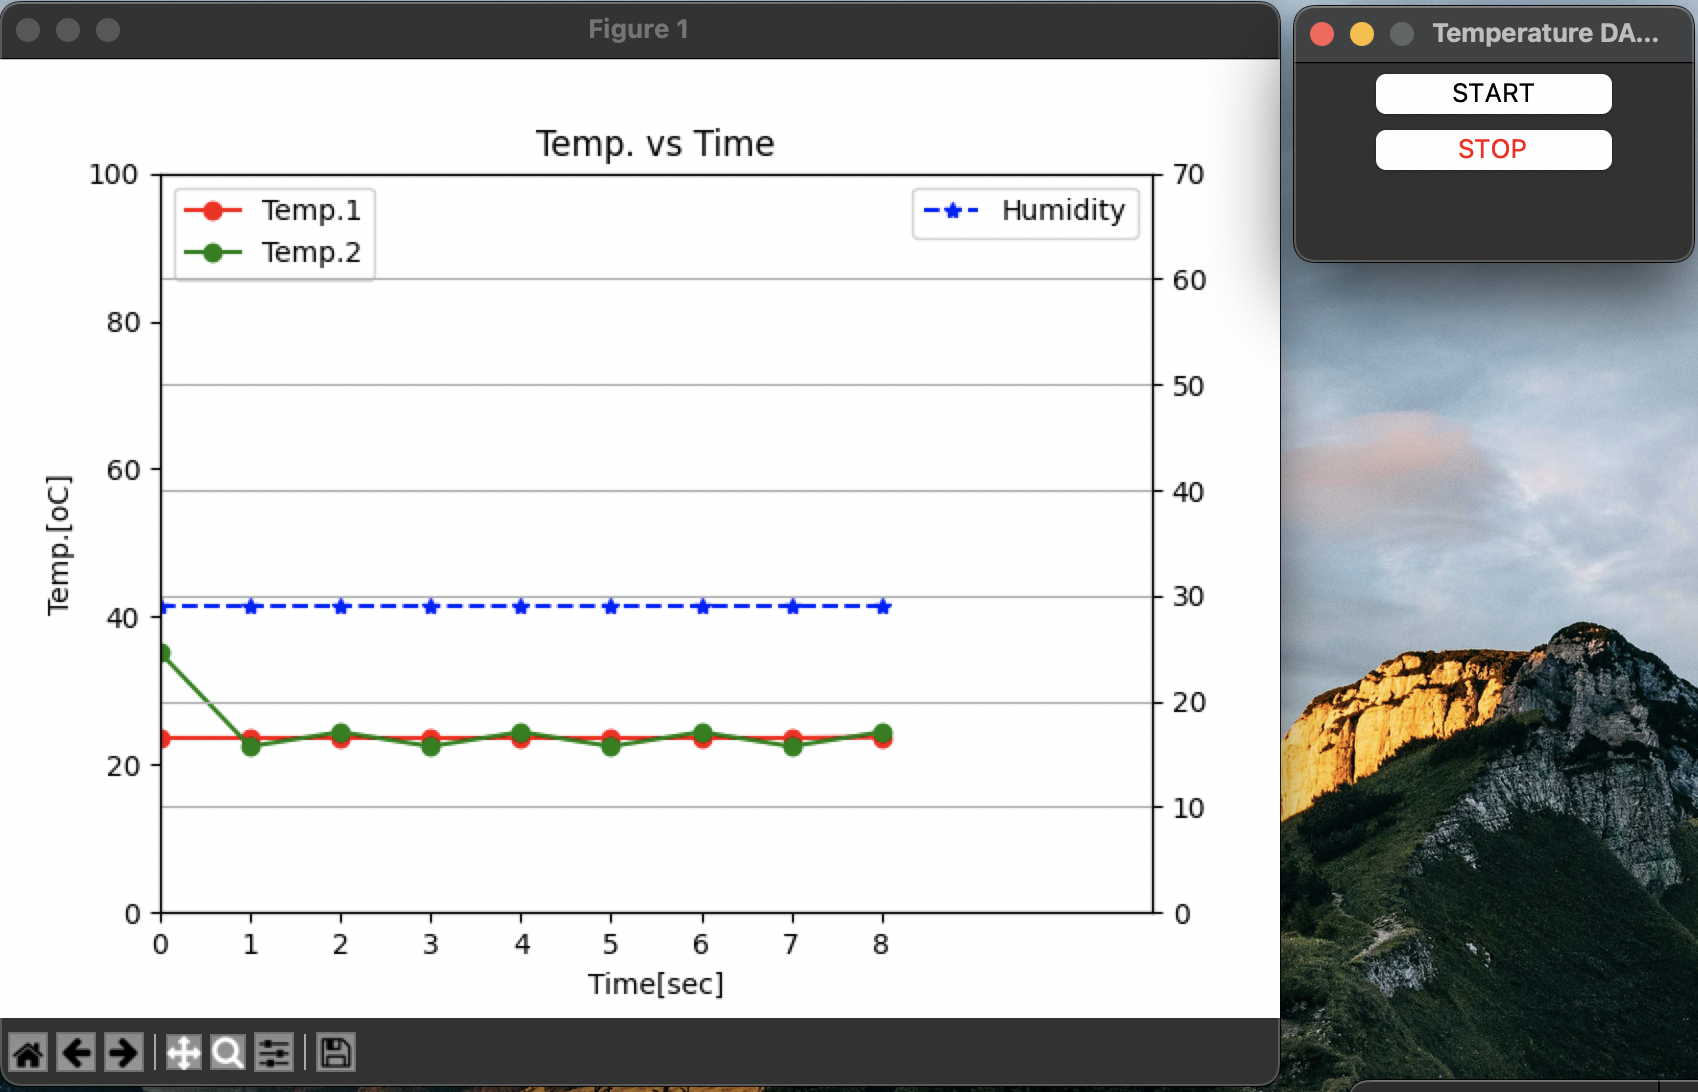
- START 누른 후 실행창
- STOP 누른 후 Terminal
- data_save.csv
| 2022-11-17 | 8:44:09 | 23.6 | 22.46 | 29 |
| 2022-11-17 | 8:44:10 | 23.6 | 21.97 | 29 |
| 2022-11-17 | 8:44:11 | 23.6 | 24.41 | 29 |
| 2022-11-17 | 8:44:12 | 23.6 | 22.46 | 29 |
| 2022-11-17 | 8:44:13 | 23.6 | 24.41 | 29 |
| 2022-11-17 | 8:44:14 | 23.6 | 22.46 | 29 |
| 2022-11-17 | 8:44:16 | 23.7 | 24.41 | 29 |
| 2022-11-17 | 8:44:17 | 23.7 | 22.46 | 29 |
반응형